Europe’s high electricity prices are there to stay for longer than anyone initially expected, and the CO2 EU ETS system is one of the main drivers. Historically we know that commodity market cycles last on average 24 months. Meaning that if we consider that the start of the bull commodity market cycle was in Nov’20, as this is when the major European power prices began to rebound, it may last to, at least, Nov’22 before we can begin to see a price correction.
However, whether this bull market cycle is going to last to Nov’22 or longer, there’s more meaning behind the latest electricity price evolution. This is likely a start of a new era of long-term high electricity market prices. The below article is focused on the wider EU policies towards the green energy economy and their role in the electricity market price formation.
Therefore, it’s important to understand how the CO2 EU ETS system changed the course of the electricity market price for the next decade.
What is CO2 EU ETS system?
The CO2 EU ETS is a cornerstone of the EU’s policy to combat climate change and its key tool for reducing greenhouse gas emissions cost-effectively. It is the world’s first major carbon market and remains the biggest one.
The scheme was initially set up in 2005 in order to reduce greenhouse gas emissions from power generators and energy-intensive industries. There were annual CO2 reduction targets set for the industries. These targets would need to be met or a penalty for non-compliance was introduced. To achieve this CO2 government target, power generation companies, such as Coal and Gas-fired power plants would need to procure these tradable carbon allowances for each 1 tonne of CO2 emitted.
In the first years, the market price of CO2 allowances was relatively low and hence had a negligible impact on supplier generation margin. However, the EU ETS policy foresaw a gradual reduction in the amount of CO2 certificates auctioned every year. As a result of reducing CO2 supply and increasing emissions by industries, the price began to rise.
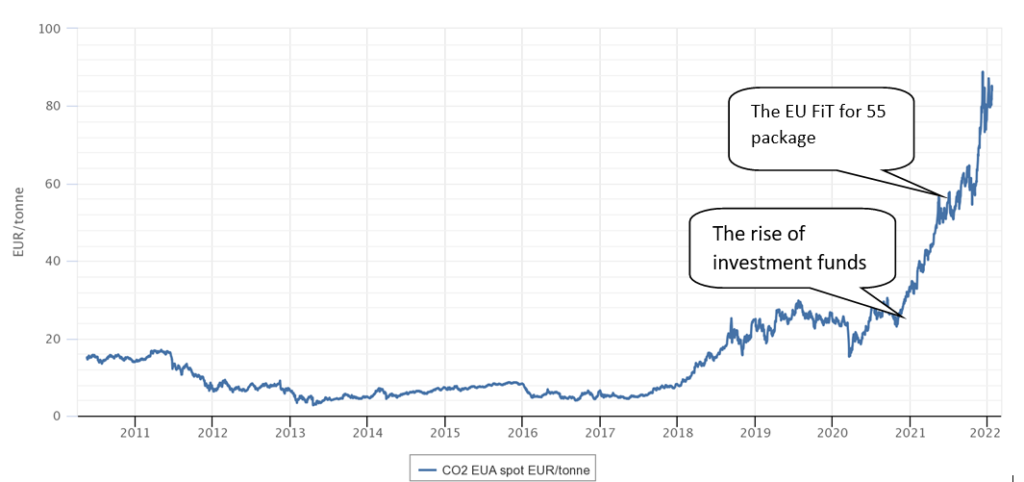
The price increased from 5-10 EUR/tonne before 2018 to 20-25 EUR/tonne between 2018 – 2020.
Then following the collapse of the financial market at the peak of the global pandemic back in Mar-Apr 2020, the worlds’ central bank decided to introduce several fiscal stimuli leading to high inflation of market assets. In addition, the EU and USA have introduced financial packages aiming to accelerate the transition to green economics. The EU has put forward a clear roadmap with the ambition to become the world’s first climate-neutral continent by 2050. With trillions of dollars of committed investments over the next 10 years, there were several investment funds emerged and started to place speculative bets on the market price of CO2 EUA carbon price allowances.
Then, On 14 July 2021, the European Commission adopted a series of legislative proposals on how to achieve climate neutrality in the EU by 2050 and the intermediate target of at least 55% net reduction in greenhouse gas emissions by 2030. And to achieve this new, ambitious target, there needed to be a reform done to the EU Emissions Trading System (EU ETS). The revised EU ETS Directive, which will apply for the period 2021-2030, will enable this through a mix of interlinked measures including an even rapid reduction of CO2 supply allowances into the market.
In light of these policy changes as well as an increased amount of money inflows into the market, the price of CO2 allowance increased from 20-25 EUR/tonne before 2021 to above 85 EUR/tonne today. And the market participants expect the price to consolidate above 100 EUR/tonne soon.
Historical evolution of CO2 EUA Market Price, EUR/tonne
What does it mean for the electricity price?
First, it’s important to know that the current electricity market prices are formed based on the marginal production cost of a power plant (Marginal cost of generation €/MWh = Marginal cost of Fuel + Variable operations and maintenance costs). While the wholesale electricity market price is set based on the merit order effect. Meaning that the sequence in which power demand is fulfilled starts with the cheapest power plant to more expensive at the end. In other words, the power price we see in the market is the marginal cost of the most expensive power plant.
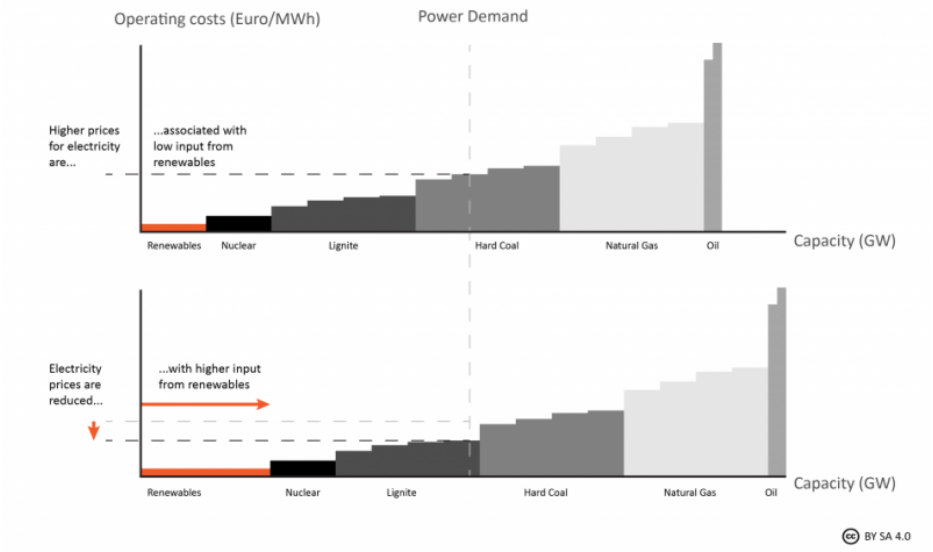
Therefore, power stations with high generation costs such as gas-fired and hard coal-fired plants usually set the market prices. The problem comes with the increased price of CO2 allowances that the Gas and Coal power plants need to buy from the market today to reach their GHG reduction objectives. We know that the price of CO2 increased by >300% when compared to the previous years. And this has a big impact on the long-term average electricity price. We can calculate the impact by using the typical Short-Run Marginal Cost formulas for Gas and Coal power plants.
SRMC Coal (Short-Run Marginal Cost)
Coal SRMC = 366,3/1130*Coal Price Y+1 + 900*CO2 Price/1000 + 4
SRMC Gas
Gas SRMC = 1,9*(TTF Gas Price Y+1+0,3) + 400*CO2 Price/1000 + 5
As a result of this calculation, we can conclude that the impact on power price €/MWh for each 1 tonne CO2 change – 0,5 €/MWh.
If we substruct the difference between the new price of CO2 ~85 EUR/t – 25 EUR/t historical value, we have a difference of 60 EUR/t multiplied by 0.5 €/MWh this leads to ~+30 €/MWh impact on the average price of electricity.
Therefore, even if there will be a market price correction, we should not expect the same electricity price level as before 2021. And as we are entering the new era of high electricity market prices, it would be important to make procurement (hedging) decisions in line with the new average.
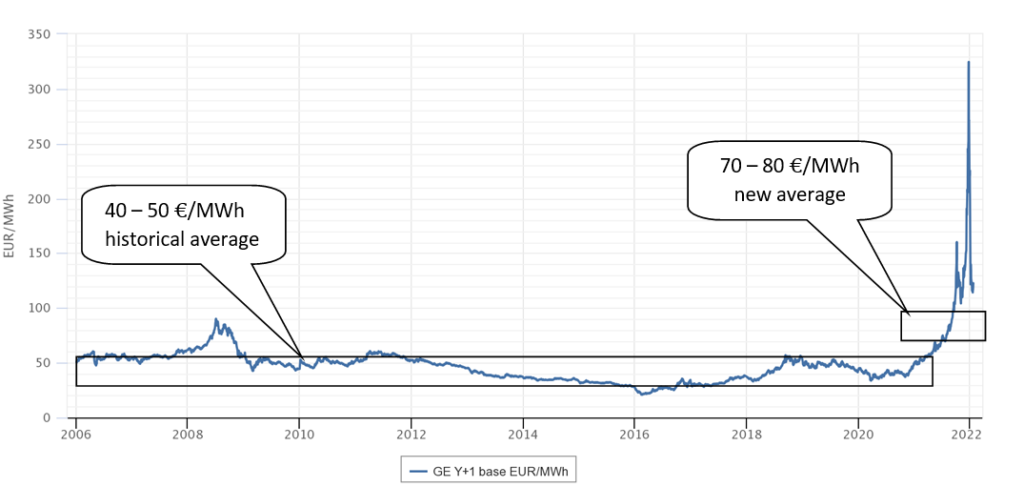
As an example, if we take the German price of electricity, then it was around 40-50 EUR/MWh for the baseload power historical average. The new market price average is likely going to be 70 – 80 €/MWh in the coming years. And although the current forward market price is still high, it’s not that far away from the new market average level.
Historical Evolution of German Year-Ahead Power Price, EUR/MWh
To learn more about the European electricity market price history, please check my other article. If you find this article useful and/or have any questions/topics you wish to further discuss, please leave your comment below. Here you can learn more about the recent power market price capping in Spain and in Portugal. Thank you for your time!





Pingback: (2022) The History of European Energy Market Falls or The Bull Market of 2022 - Futrue Energy Go
Pingback: (2022) Spain And Portugal Are Capping Gas Prices To Calm Down The Power Market | Futrue Energy Go