Table of Contents
PPA Price Trends – Q3 2023 Edition
Welcome to our quarterly PPA Price Trends series, where we take a deep dive into the ever-evolving landscape of renewable energy markets. In this Q3 2023 edition, we’re excited to unveil the most current and insightful observations on Power Purchase Agreement (PPA) price trends. If you want to read our previous articles on this topic, please check it out here.
Before, however, we embark on our in-depth exploration of the Q3 2023 PPA price trends, it’s crucial to understand the broader energy market dynamics. Since the conventional energy market forces often have a profound influence on the PPA prices. Therefore, by understanding the broader energy landscape, we can better know the context in which PPA market dynamics unfold.
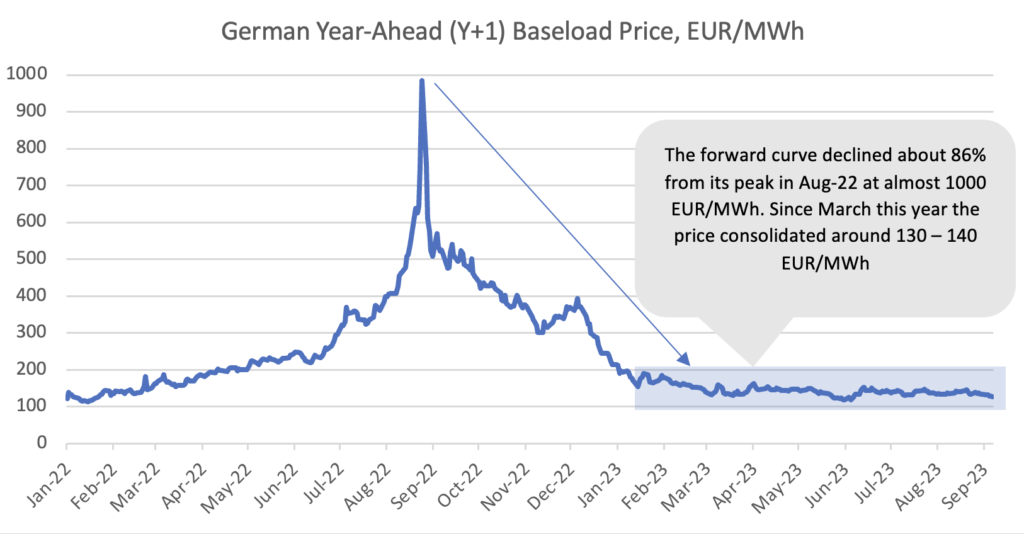
Commodity prices fell in 2023 from their record highs, providing needed relief for multiple corporate buyers and consumers. Several key factors converged to facilitate this significant shift.
Firstly, the relatively mild winter experienced during 2022/23 mitigated the typical surge in energy demand associated with colder temperatures, thereby tempering the upward pressure on energy prices. Secondly, the European Union (EU) witnessed robust liquefied natural gas (LNG) supplies and ample stockpiles, fostering an environment of supply stability in the face of potential disruptions. Furthermore, a reduction in industrial energy demand, partly influenced by the high energy costs in 2022, played a pivotal role in easing the upward price trajectory. These factors, combined with a generally favourable macroeconomic background, culminated in a decline in commodity prices.
If you are interested to learn more about general energy market trends, you can visit our weekly energy market updates here.
What’s going on with the PPA market?
As the world grapples with the urgent need to combat climate change, the trends in Power Purchase Agreement (PPA) prices have taken center stage. Those are the most current PPA energy market characteristics:
- Italian PPA activity continues to accelerate with multiple projects and suppliers;
- Solar PV is the main offering in the market for new-built projects, while Wind is the second most popular technology where most of the projects existing (operational);
- Fixed PPA price structure is the most common indicating that developers and investors are still interested in capturing the high market price levels;
- There are still plenty of projects in Europe with sooner PPA COD date in 2025-2026;
- Pas-as-Produced (PaP) PPA price structure is still the most common as in the prior year whereas baseload PPA offers almost don’t exist or are priced at a significant premium;
- CPI inflation indexed contracts continue to gain popularity;
- Financial PPA contract structures are becoming most common, yet some corporate buyers might be still reluctant to this solution due to its accounting P&L volatility. You can learn more about the P&L volatility here.
- Average PPA contract tenure still about 10 years whereas UK PPA often last 15 years;
- PPA price levels remain largely unchanged from the previous year where the decline in PPA power price was offset by the increase in GO prices.
- PPA shaping and balancing costs are still significantly higher than the historical average.
Those are some of the most prominent trends we have foreseen in 2023 so far. As the PPA energy market continues to evolve, it can be challenging for multiple corporate buyers to navigate this dynamic PPA market landscape. To provide valuable assistance in this journey, I have published a comprehensive PPA Energy Guide. This guide aims to equip businesses with the knowledge and insights needed to make informed decisions in the ever-changing world of renewable energy procurement.
The Soaring Price of Financing
As a result of the rising financing costs, levelized costs of electricity for solar and wind projects increased, making prices of Power Purchase Agreements (PPAs) largely unchanged from the previous year. Yet, not all PPA markets are even. Some still have greater PPA deal opportunities than other markets, which we are going to explore in this article.
But first, let us understand what is Levelized Cost of Electricity (LCOE)?
This simple yet powerful metric is an important component of PPAs, influencing their pricing, feasibility, and overall impact on our transition to a sustainable energy future. In simple terms, LCOE is the per-unit cost of electricity produced by a renewable project spread out evenly over its expected lifespan. LCOE costs depend on the below variable:
- Initial Investment: This includes everything from building the infrastructure to acquiring the necessary technology.
- Operating and Maintenance Costs: These are the day-to-day expenses required to keep your project running smoothly.
- Expected Lifetime: How long will your solar panels or wind turbines keep spinning? This is a critical factor in LCOE.
- Discount Rate: Think of this as the interest rate on your investment. It reflects the opportunity cost of tying up your money in this project rather than elsewhere.
For buyers and sellers in the renewable energy market, LCOE is the ultimate benchmark. Because when you sign a PPA, you’re essentially locking in the price you’ll pay for electricity generated by a renewable energy project for a predetermined period, often several years. Therefore, knowing LCOE evolution helps to make informed decisions.
Average LCOE of main utility-scale renewable technologies, EUR/MWh
| Technology | United Kingdom | Germany | Spain | Italy | France | Poland |
| Solar | 50 – 60 | 42 – 50 | 29 – 38 | 35 – 42 | 35 – 40 | |
| Onshore Wind | 39 – 53 | 40 – 52 | 24 – 37 | 40 – 49 | 35 – 45 | 48 – 61 |
| Offshore Wind | 58 – 74 | 72 – 90 | 120 – 160 | |||
| Battery Storage (4h) | 153 – 176 | 155 – 185 |
Spain has the lowest energy LCOE cost in our comparison. Spain’s success can be characterized by its abundant sunlight and wind resources, strategic investments in renewable infrastructure and grid integration and favorable regulatory environment as well as supportive policies that attract investments and drive competition. Globally, it is forecasted that LCOE costs will continue to decline in the foreseeable future due to constant technological and manufacturing efficiency improvements.
PPA “pay-as-produced” price indication as of September 2023
| Q2 2022 | Q3 2022 | Q4 2022 | Q1 2023 | Q3 2023 | |
| Market | 10y “pay-as-produced” PPA, EUR/MWh | 10y “pay-as-produced” PPA, EUR/MWh | 10y “pay-as-produced” PPA, EUR/MWh | 10y “pay-as-produced” PPA, EUR/MWh | 10y “pay-as-produced” PPA, EUR/MWh |
| France | 95 | 130 | 90 | 70 | 85 |
| UK | 100 | 100 | 100 | 85 | 90 |
| Germany | 85 | 100 | 90 | 80 | 85 |
| Italy | 80 | 90 | 85 | 75 | 85 |
| Poland | 140 | 150 | 90 | 55 | 95 |
| Portugal | 44 | 45 | 50 | 45 | 43 |
| Spain | 44 | 45 | 48 | 45 | 40 |
The PPA corporate activity in volumes (MWh) contracted slowed down in 2023 when compared to 2022. Europe and America remain top PPA destinations, while India and Africa are actively emerging. The lower PPA deals activity in 2023 is mainly due to historically long interconnection as well as the decline in power price market indices this year that allow for alternative and cheaper renewable solutions than PPAs.
Across the market in the table above, we observe an average increase of 14% in PPA market prices for an average 10-years deal with a Pas-as-Produced (PaP) price structure. Poland and the UK have emerged as among the most expensive PPA markets. However, a unique exception stands out in the form of the Spain-Portugal market, where PPA prices have instead experienced a decline. This divergence underscores the market-specific factors that can influence pricing dynamics.
United Kingdom – Commentary on UK CfD PPA Scheme
The corporate PPA market in the UK remain to be dominated by the governmental CfD auctions. The Contract for Difference (CfD) is a government support mechanism introduced in the United Kingdom to incentivize the development of low-carbon electricity generation projects, particularly renewable energy sources. It is designed to encourage investment in renewable energy technologies by providing long-term revenue stability and reducing risks for investors.
Contracts for Difference (CfDs) in the UK is a 2-way CfD for 15-year contracts. They guarantee a subsidy top-up for projects when the market price falls below the clearing price. However, when the market price exceeds the clearing price, participants do not get to benefit from the surplus. So far, the program has granted contracts for 9.8GW of offshore wind capacity and 1GW of onshore wind across three rounds.
In February of 2022, the government announced that the auctions, which were previously held every two years, would now occur annually. This adjustment is scheduled to come into force starting from March 2023, coinciding with the upcoming auction round.
As a result of this modification, a scenario has emerged in which numerous developers of renewable projects and investors are showing a stronger preference for engaging in CfD agreements over corporate Power Purchase Agreements (cPPA), unless a corporation is prepared to offer a price higher than that established by the government. And the corporate premiums are, unfortunately, much higher than one could expect.
The Historical UK CfD PPA Auction Results
| UK CfD PPA Auction Results, GBP/MWh | 5th Round Results | 4th Round Results | 3rd Round Results | 2nd Round Results | 1st Round Results |
| 8th Sept 2023 | 7th July 2022 | 20th Sept 2019 | 11th Sept 2017 | 26th Feb 2015 | |
| Solar PV (>5MW) | 47.0 | 46.0 | 50.0 – 79.2 | ||
| Onshore Wind (>5MW) | 52.3 | 42.5 | 79.2 – 82.5 | ||
| Remote Island Wind (RIW) | 52.3 | 46.4 | 39.7 | ||
| Floating Offshore Wind | 87,3 | ||||
| Offshore Wind | 37.4 | 39.7 | 57.5 – 74.8 | 120.0 – 114.4 |
Final Words
In conclusion, the fall in commodity prices in 2023 brought temporary relief to corporate buyers and consumers, but the renewable energy sector faced its own set of challenges due to central banks’ interest rate hikes.
This resulted in an increase in the levelized costs of electricity for solar and wind projects, keeping the prices of Power Purchase Agreements at a similar level to the previous year.
As we move forward, we can expect the PPA prices to continue to be at the elevated levels due to the growing demand among corporate buyers and inflationary pressure. We also should expect new price structures to emerge as Wind and Solar generation slowly moving to battery integration solutions and smart market price risk management technologies.
I hope this article provided more insights into Q3 2023 PPA Energy Market Trends and showcased the latest market developments. If you found this article informative, please share it with your colleagues and peers. Don’t forget to subscribe to our newsletter to receive future updates directly in your inbox!
Finally, if you need support in navigating complex corporate PPA agreements to ensure that you are employing the best market practices, feel free to check out our Products.
Curious to learn more about PPAs? Our guide offers a concise roadmap to navigate Power Purchase Agreements (PPAs). Learn more here.

